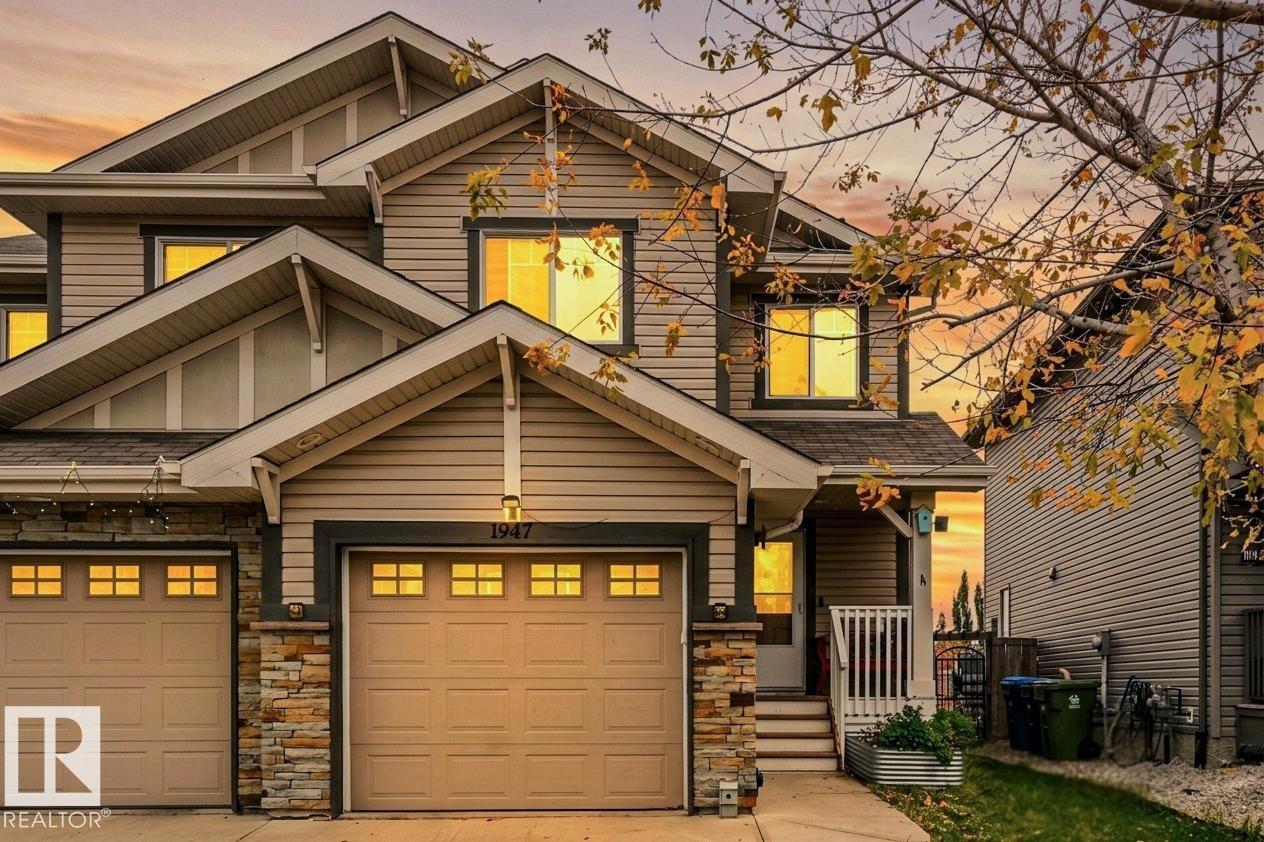
 New
New$439,900
383 bd3+1 ba1,582 ft²$278/ft²
1947 118 St SW
DuplexRutherford (Edmonton)3 days ago
E4513156 · Courtesy of RE/MAX Professionals
REALTOR.caSouthwest Edmonton · Neighbourhood profile
Southwest Edmonton at below-premium prices — newer homes, finished streets, and a flat decade behind it.
Median assessed
$403,500
4,406 residential properties
Vs. Edmonton
-5.5%
city median $427,000
Est. 2026 property tax
$4,182
10.3637 per $1,000 assessed
Population
11,620
2021 Census
Live MLS® listings, newest first.
New3 bd3+1 ba1,582 ft²$278/ft²
E4513156 · Courtesy of RE/MAX Professionals
REALTOR.ca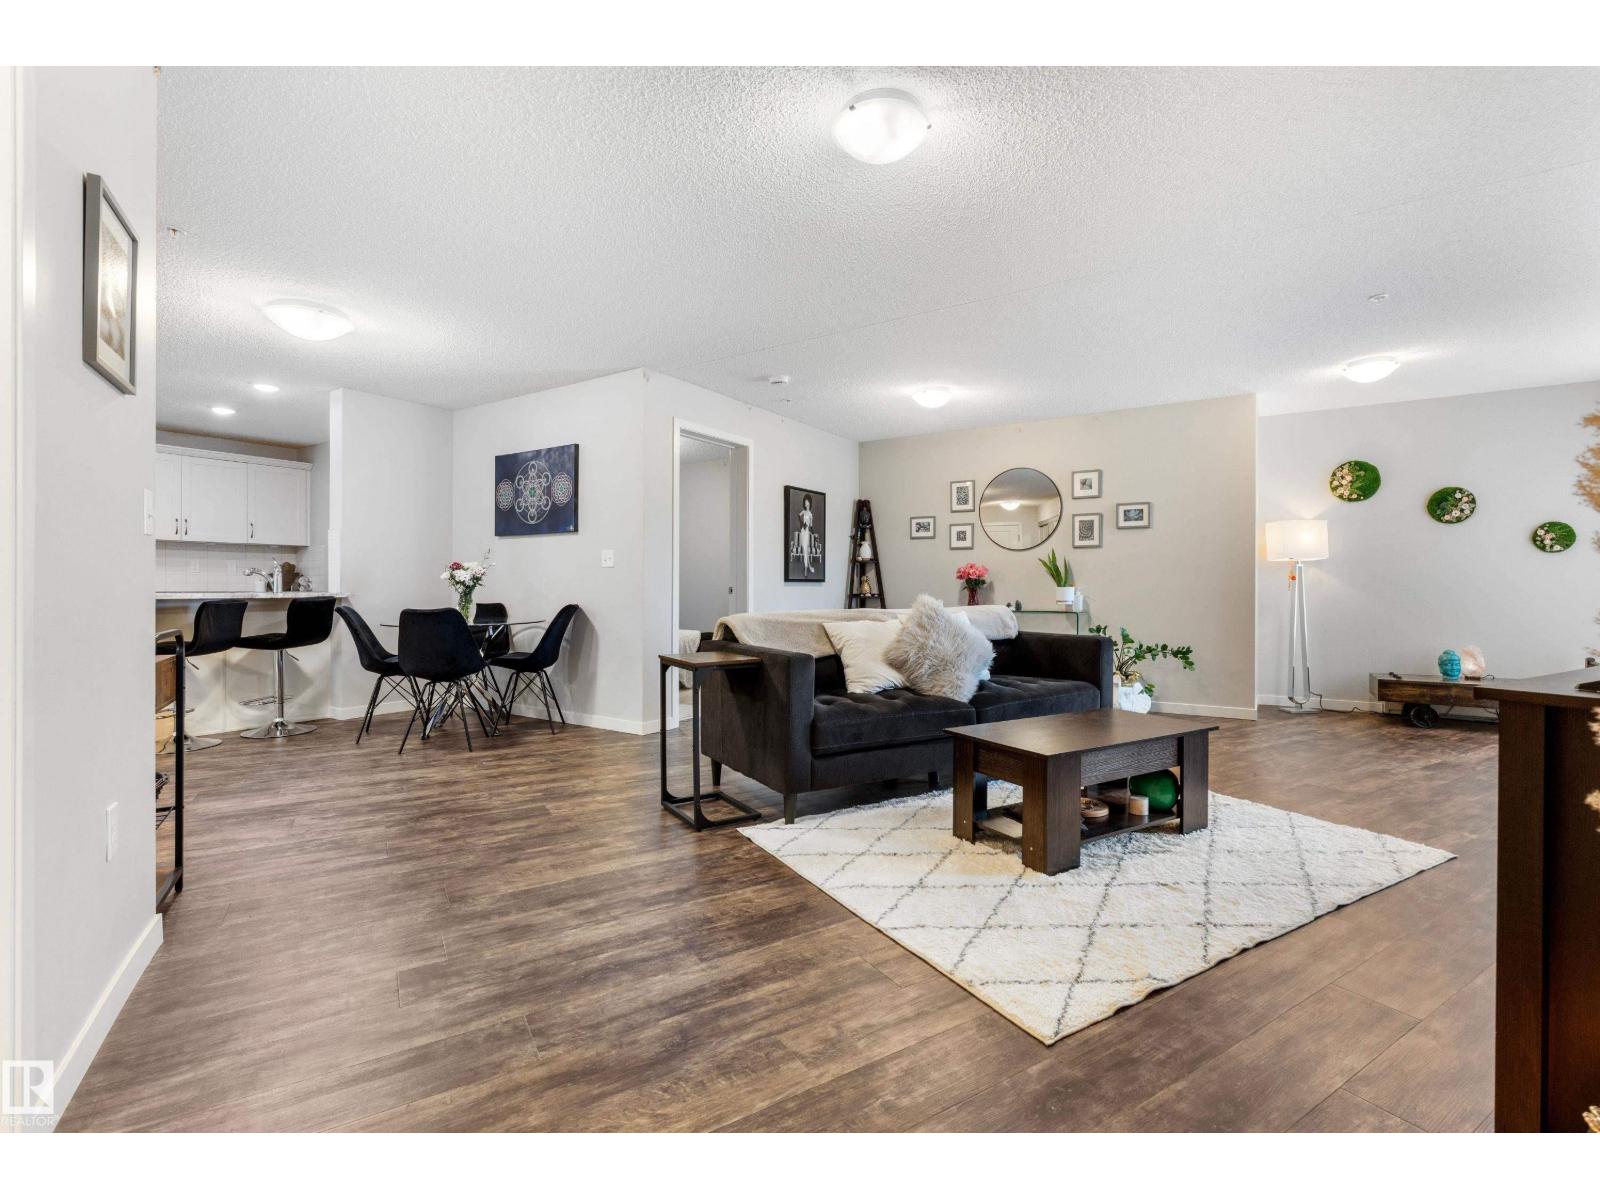 New
New1 bd2 ba1,024 ft²$234/ft²
E4512945 · Courtesy of RE/MAX PREFERRED CHOICE
REALTOR.ca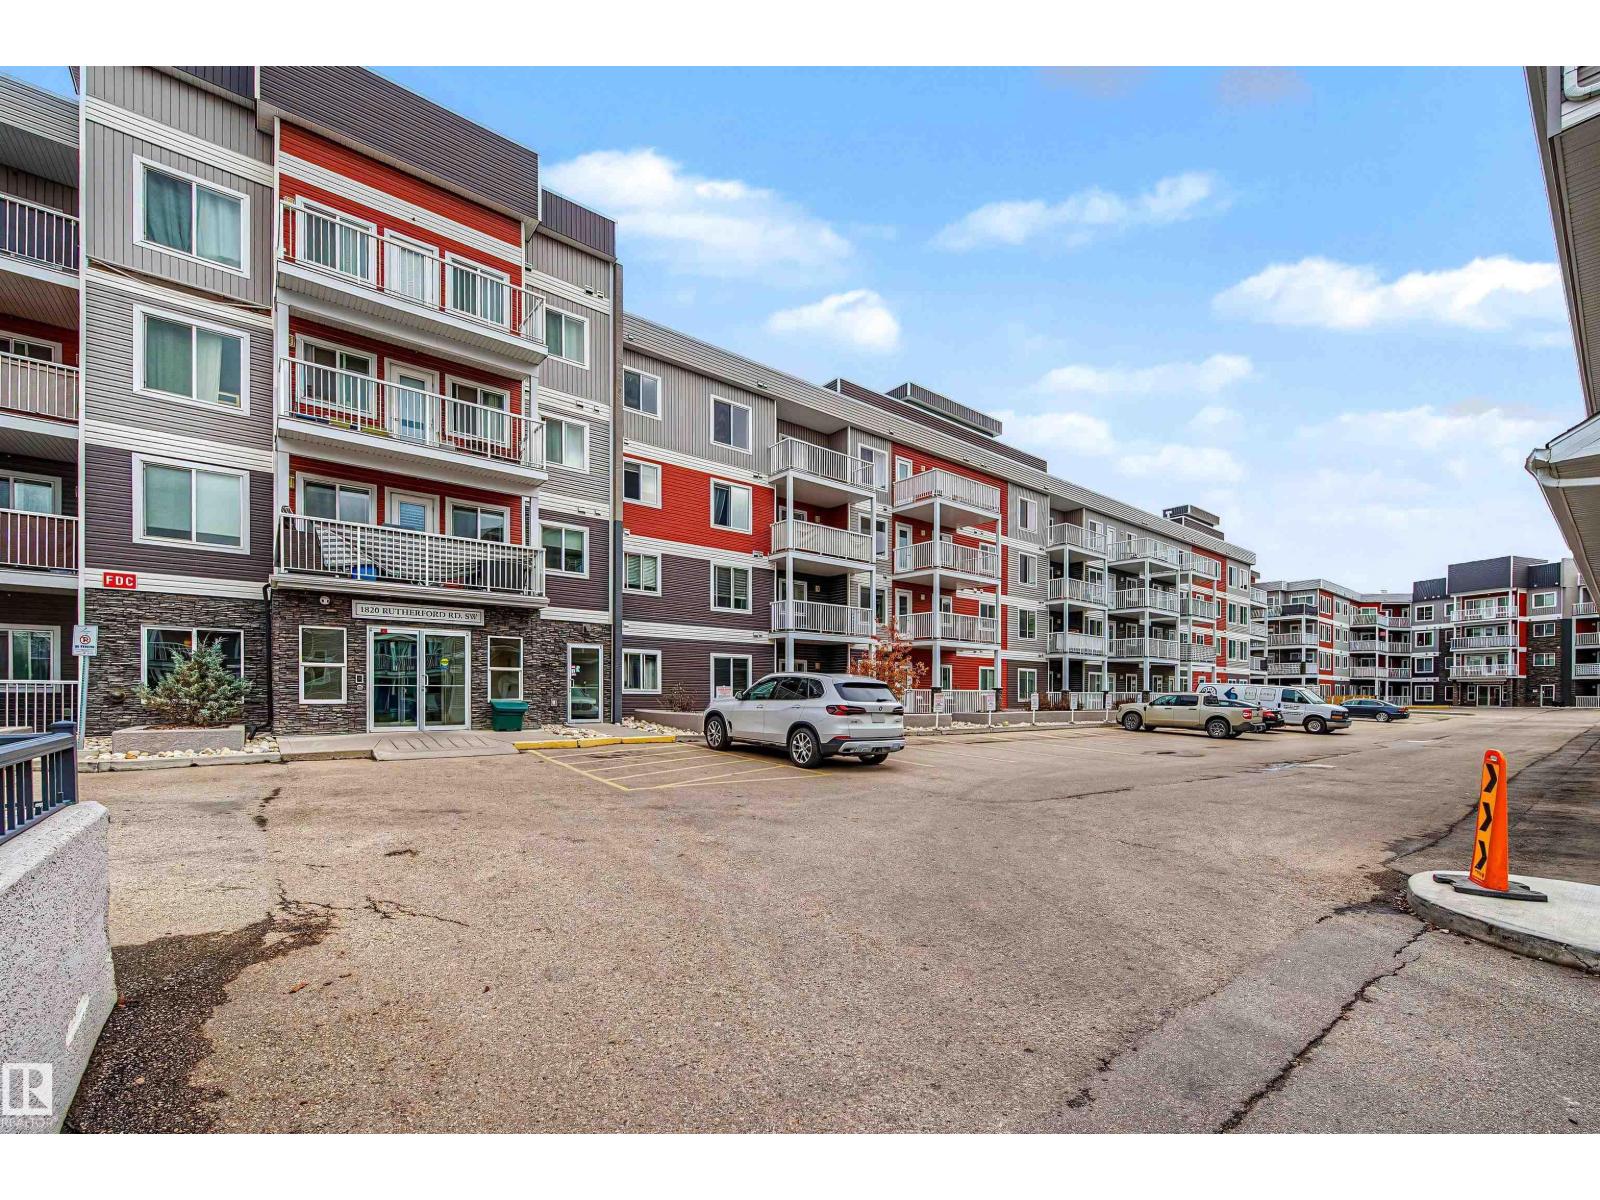 New
New2 bd2 ba1,078 ft²$249/ft²
E4512739 · Courtesy of Century 21 Masters
REALTOR.ca New
New2 bd2 ba838 ft²$237/ft²
E4512705 · Courtesy of Kairali Realty Inc.
REALTOR.ca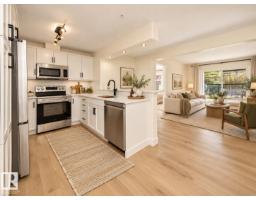
2 bd2 ba920 ft²$299/ft²
E4512311 · Courtesy of REMAX River City
REALTOR.ca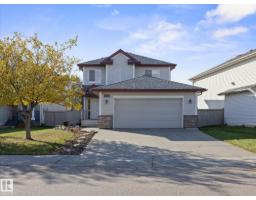
3 bd2+1 ba1,682 ft²$291/ft²
E4512271 · Courtesy of Real Broker
REALTOR.caMLS® listing content on this page is made available under our Terms of Use.
Christopher Peel · REALTOR®
MaxWell® Polaris
This website is operated by Christopher Peel, REALTOR®, of MaxWell Polaris, Edmonton, Alberta — the brokerage responsible for this website.

The listing data above is provided under copyright by the Canadian Real Estate Association (CREA). The listing data is deemed reliable but is not guaranteed accurate by CREA nor BestYEGHomes.
Listing information last updated on October 18, 2026 at 12:30 a.m. MT.
Rutherford is the practical southwest option. You get post-2003 construction, family-sized homes and quiet finished streets, without the price the neighbourhoods a few minutes west command. For buyers who want the southwest address and cannot justify the premium beside it, that trade is the entire appeal, and it is a legitimate one.
Rutherford's assessed values have barely outrun a decade. The value history below shows a drop into 2020 and a recovery since — about one percent a year compounded over the whole span, before inflation and before what it cost to own the house. If you are buying a home to live in, that is survivable. If you are buying it as an investment, read that table twice.
The place
Life here is straightforward suburban and it works. Family parks, good school access, and Heritage Valley Town Centre close by for shopping. Blackmud Creek Ravine gives the neighbourhood real green space rather than a strip of grass. Currents of Windermere is a short drive when you want more choice.
Commuting runs on Anthony Henday Drive and 111 Street, and both do the job. ETS buses serve the area and a Heritage Valley transit centre is planned. As with most of the southwest, a household here should assume it needs two vehicles.
The neighbourhood is finished. No residential-construction permits have been filed here recently, and the assessment roll has been flat for years. Nobody is knocking anything down or building beside you — the streetscape you view on a Saturday is the one you get.
What stands out
The price band
Rutherford’s median residential assessment sits at $403,500 — 5.5% below the Edmonton median of $427,000. Here is how that compares with the neighbourhoods right next door, which is the comparison that actually shapes what you can buy for your money.
One caution on reading this chart: each bar is a median across every residential property in that neighbourhood, houses and apartment condos together. An area with a lot of condo stock reads lower here — not because its houses are cheaper, but because the mix is different.
Source: City of Edmonton Open Data, property assessments (q7d6-ambg) — 2026 assessment and tax year. Residential properties assessed at $100,000 or more, which excludes parking stalls, storage units and vacant land. Assessed values are the City’s valuations for tax purposes, not sale prices.
Inside the range
The City records whether a property has a garage. That is a rough stand-in for the detached-house stock and nothing more — plenty of houses have no garage, and the flag says nothing about building type.
The longer view
+11.9% in the median between 2015 and 2026, while the roll gained 300 properties.
Source: City of Edmonton Open Data, historical property assessments (qi6a-xuwt). Residential parcels assessed at $100,000 or more. The most recent year comes from the current assessment roll (q7d6-ambg), which classifies properties slightly differently — close enough to compare, not the same query.
Worth knowing
Read the table above as a rate, not a total. Spread the whole eleven-year change across eleven years and it comes to roughly one percent a year, compounded. That is the neighbourhood's nominal growth — before inflation, and before anything you spent to own the house.
That last clause is the part people skip. Property tax, insurance, maintenance and mortgage interest all ran during those eleven years, and none of them appear in a price chart. A home that appreciates at one percent a year while costing several percent a year to hold is not a bad decision, but it is not an investment either. It is shelter you happen to own, which is a perfectly good reason to buy.
The practical version, and it applies well beyond Rutherford: a neighbourhood price chart is a nominal, pre-cost, whole-neighbourhood number. Three things it is not. When someone quotes you a neighbourhood's appreciation, the useful question is what it looks like after all three adjustments.
The carrying cost
Edmonton sets one residential tax rate for the whole city, so Rutherford has no rate of its own — your bill is that rate applied to your own assessed value. At the 2026 rate of 10.3637 per $1,000 of assessment, a home at Rutherford’s median of $403,500 would carry about $4,182 a year — roughly $349 a month. The rate splits into 7.7419 municipal and 2.6218 provincial education.
Your own bill will differ, because your assessment will. If it looks wrong, it can be challenged — our Edmonton property tax guide walks through how the bill is built, and how to appeal an Edmonton property assessment covers the complaint process and its deadlines.
Source: City of Edmonton Open Data, tax rates (pwis-wc4c), 2026 residential rate, applied to the median assessment above. An estimate for the median property, not a bill for any specific one.
The honest read
What works
Southwest without the southwest premium
You get newer construction and the same access to the ring road and the shopping nodes, at meaningfully less than the communities immediately west. For a lot of budgets that is the difference between buying and not.
Nothing is being built beside you
The neighbourhood is finished and the permit record is empty. No teardowns, no showhome competing with your resale, no construction traffic.
Newer homes, older-neighbourhood calm
Post-2003 systems and floor plans, on streets that have already settled down. That combination usually costs more than this.
The tradeoffs
The appreciation record is genuinely weak
Roughly one percent a year in nominal terms across eleven years, with a real decline in the middle of it. Buy here for the house and the price, not because you expect the neighbourhood to carry you.
Two vehicles, effectively required
Transit exists and a Heritage Valley transit centre is planned, but commuting from here is a drive today. Budget it.
Limited variety
The housing stock is narrow — similar homes of a similar age. If you want a suite, a rowhouse or something with character, this is not where you will find it.
Around the neighbourhood
Verify current catchments with the school boards — boundaries change.
ETS bus routes, Anthony Henday Drive and 111 Street access, future Heritage Valley transit centre
On the market
See homes for sale in Rutherford →
Live MLS® listings, updated daily from the REALTOR.ca data feed — photos, prices, and full property details.
MLS® prices, sales, and trends for this area are free with an account.
Good to know
The public measure is the City's assessment roll, shown above alongside the city median and nearby neighbourhoods. Assessed value is a tax figure with its own date, not a sale price. For actual selling prices, MLS® pricing for the area is free with a BestYEGHomes account.
Its record does not support that case. The history above works out to about one percent a year over eleven years, with a real drop in the middle of it — and that is before inflation and before what it costs to own the place. As a place to live at a fair southwest price it holds up well; as an appreciation bet it has not delivered.
It suits buyers who want newer southwest housing at below-premium prices and value a finished, quiet neighbourhood. It suits you less if you are counting on price growth, need transit, or want variety in housing type.
Current MLS® listings for the area are on our listings pages, updated daily from the REALTOR.ca data feed. There is a link at the top of this page. Inventory in a single southwest neighbourhood can be thin at any given moment, so it is worth watching the wider Heritage Valley area too.
Detached family homes built after 2003, typically three or four bedrooms between roughly 1,400 and 2,000 square feet. The neighbourhood is built out, so the mix is stable.
n/a = fewer than 5 sales; CREA suppresses price data to protect privacy. 0 sales = no transactions recorded for that property type/area this period. Low-volume months (especially January) will show more gaps.
Keep exploring
Go deeper