 New
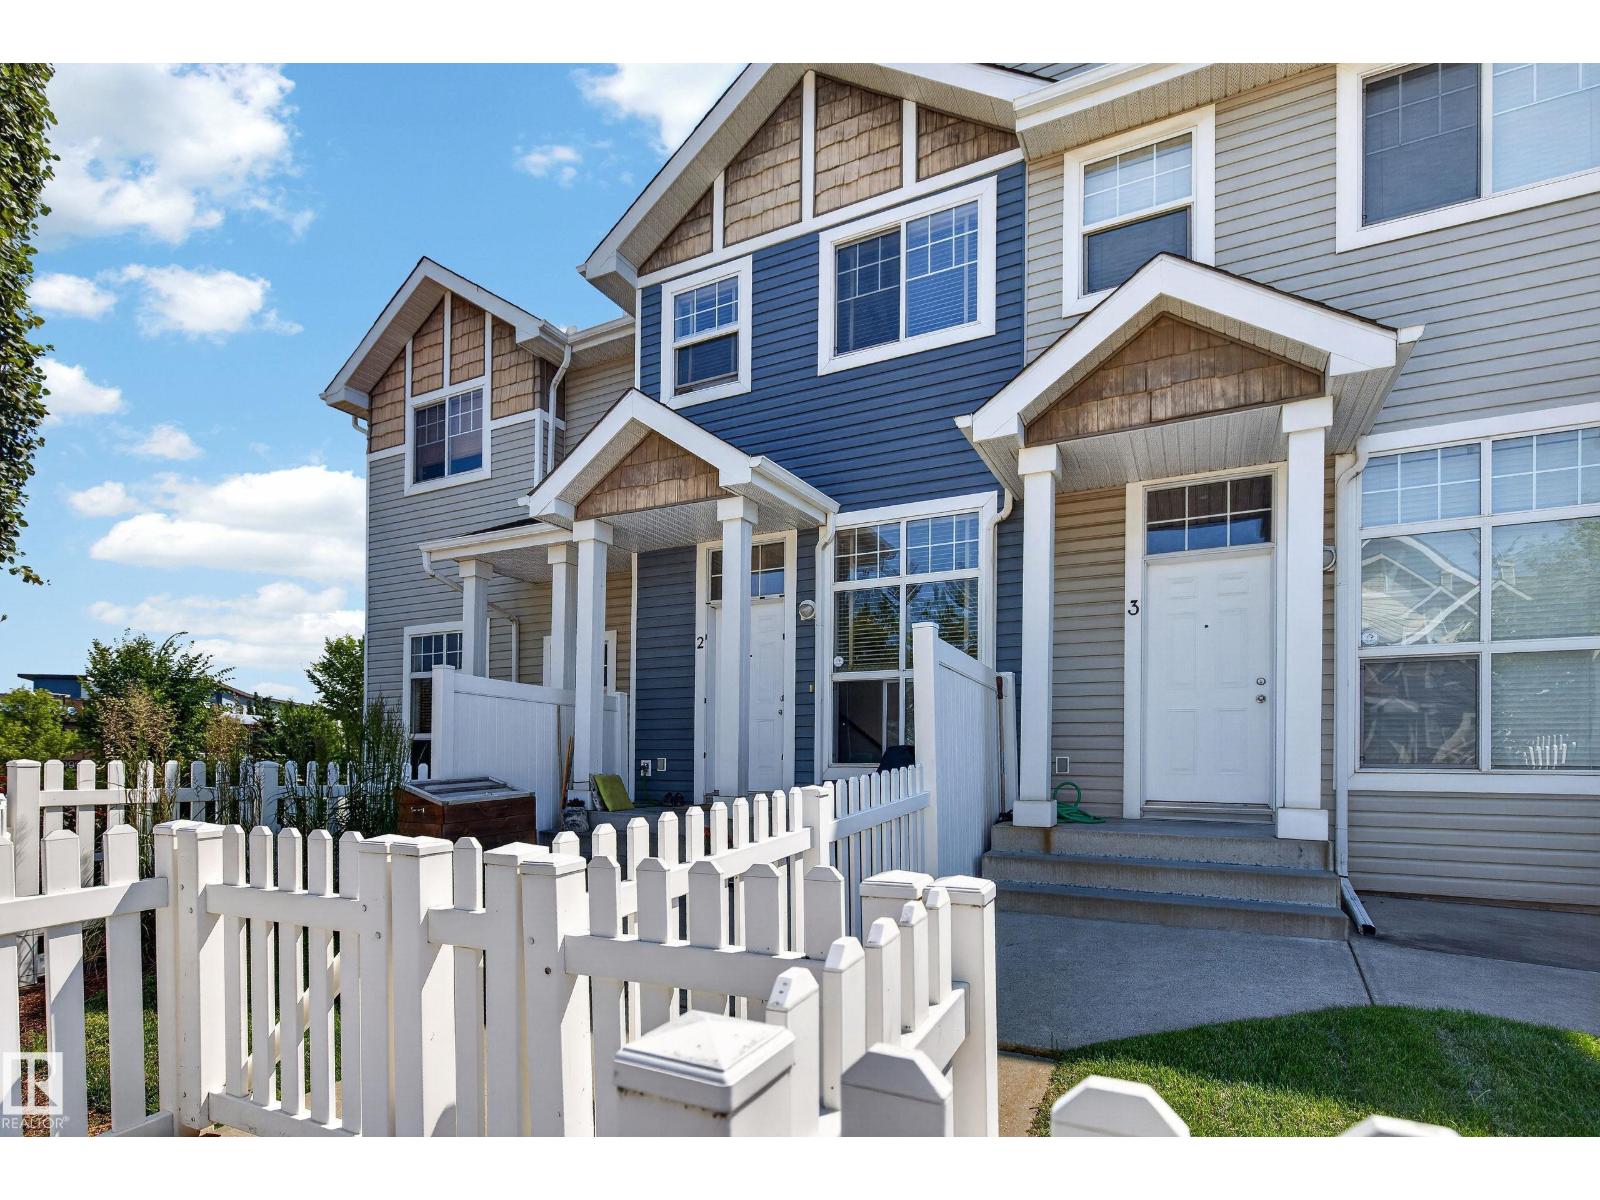
New$257,500
271 bd1+1 ba1,008 ft²$255/ft²
#2 5604 199 St NW
Row / TownhouseThe HamptonsToday
E4499556 · Courtesy of The Good Real Estate Company
REALTOR.caMarket data, neighbourhood profiles, and real estate news for Edmonton — curated by a licensed REALTOR®.
Browse homes for sale across Edmonton — try a neighbourhood like Windermere, or explore all neighbourhoods.
Just listed
Newest Edmonton Listings
MLS® listing content on this page is made available under our Terms of Use.
New1 bd1+1 ba1,008 ft²$255/ft²
E4499556 · Courtesy of The Good Real Estate Company
REALTOR.ca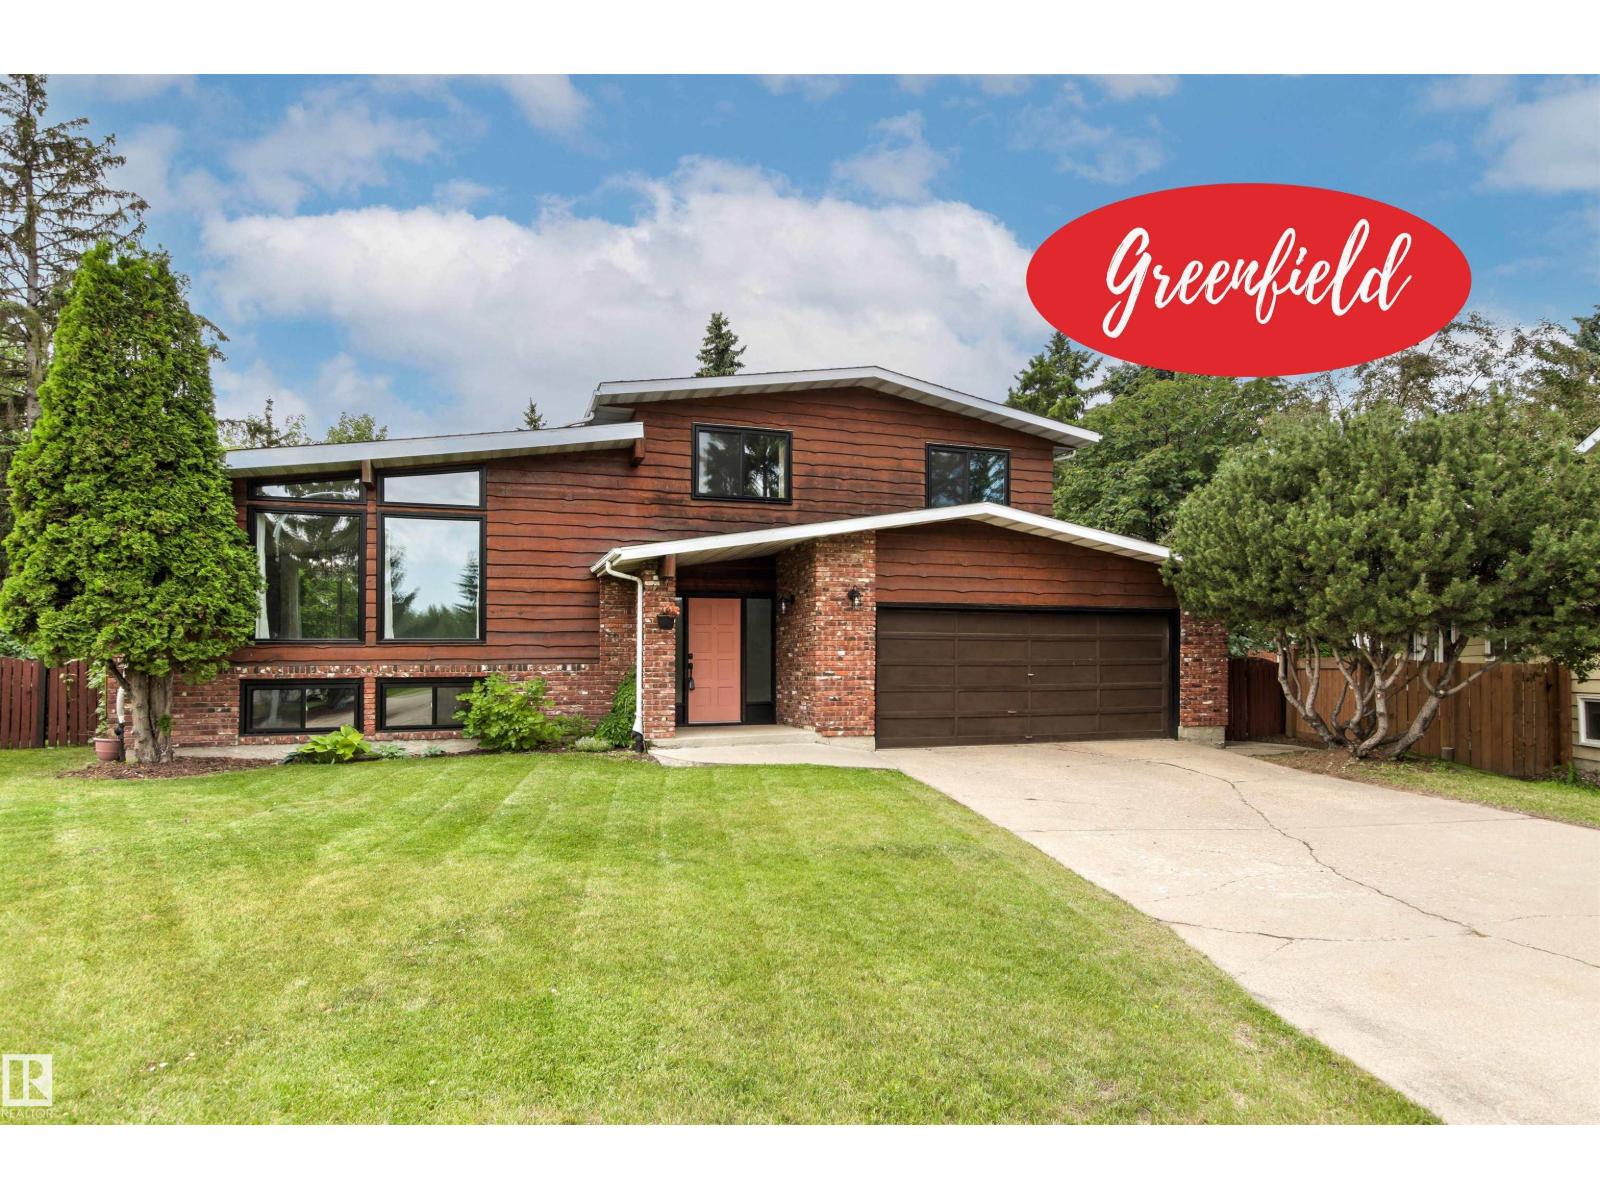 New
New3 bd2+1 ba1,612 ft²$446/ft²
E4499555 · Courtesy of Royal LePage Noralta Real Estate
REALTOR.ca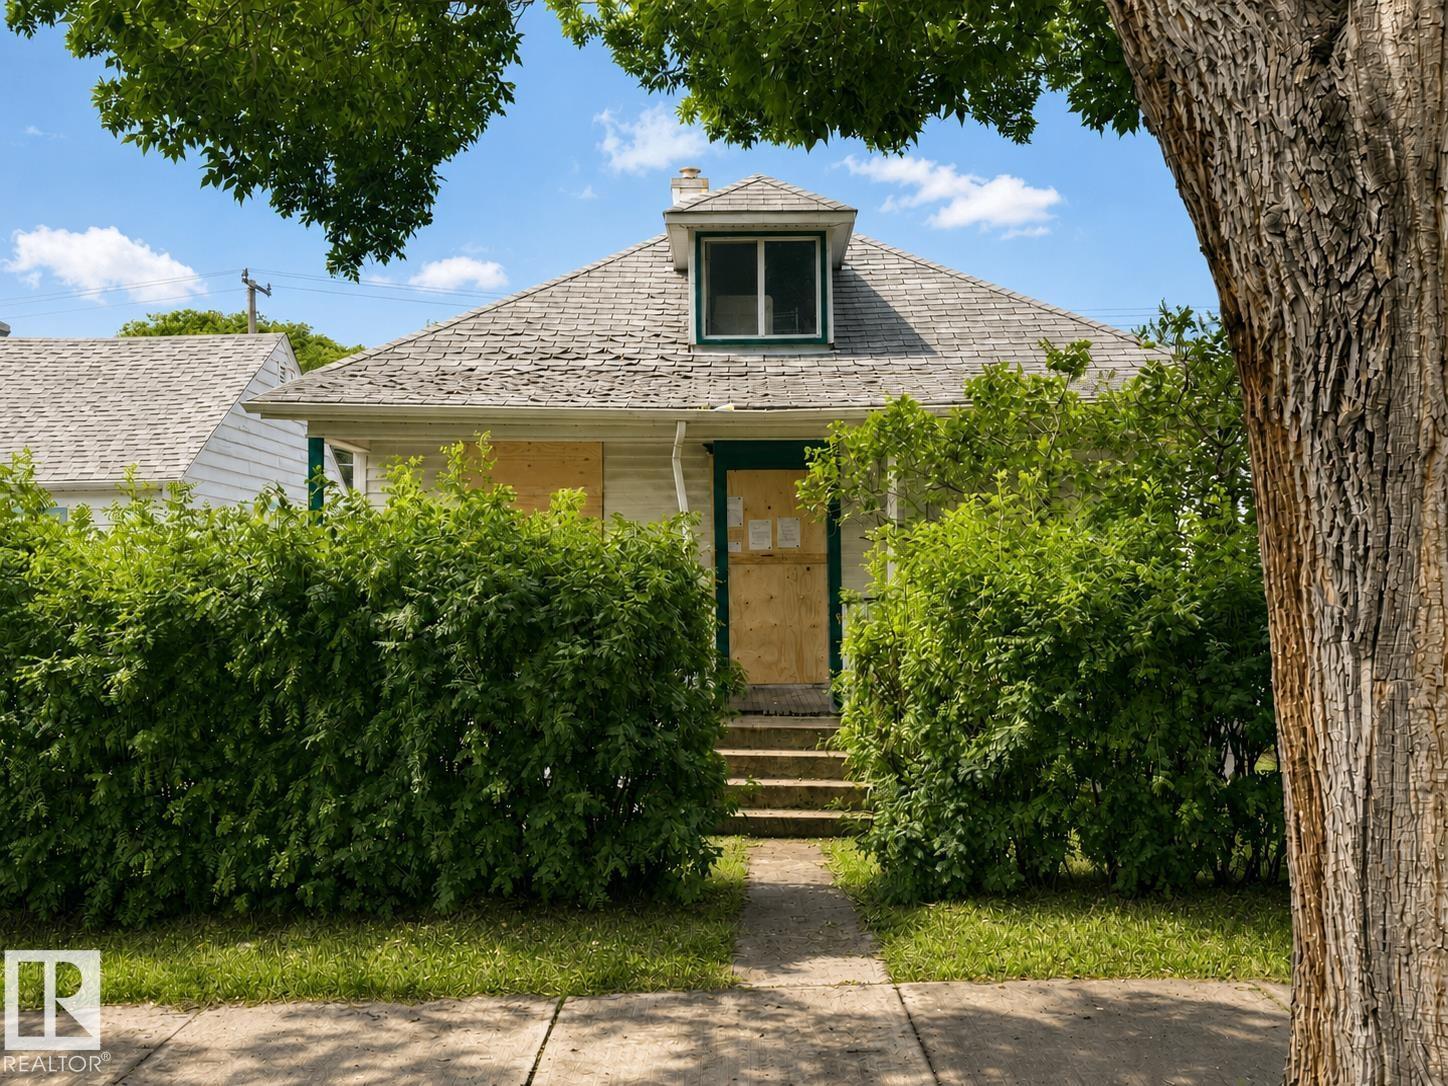 New
New2 bd1+1 ba861 ft²$209/ft²
E4499552 · Courtesy of Liv Real Estate
REALTOR.ca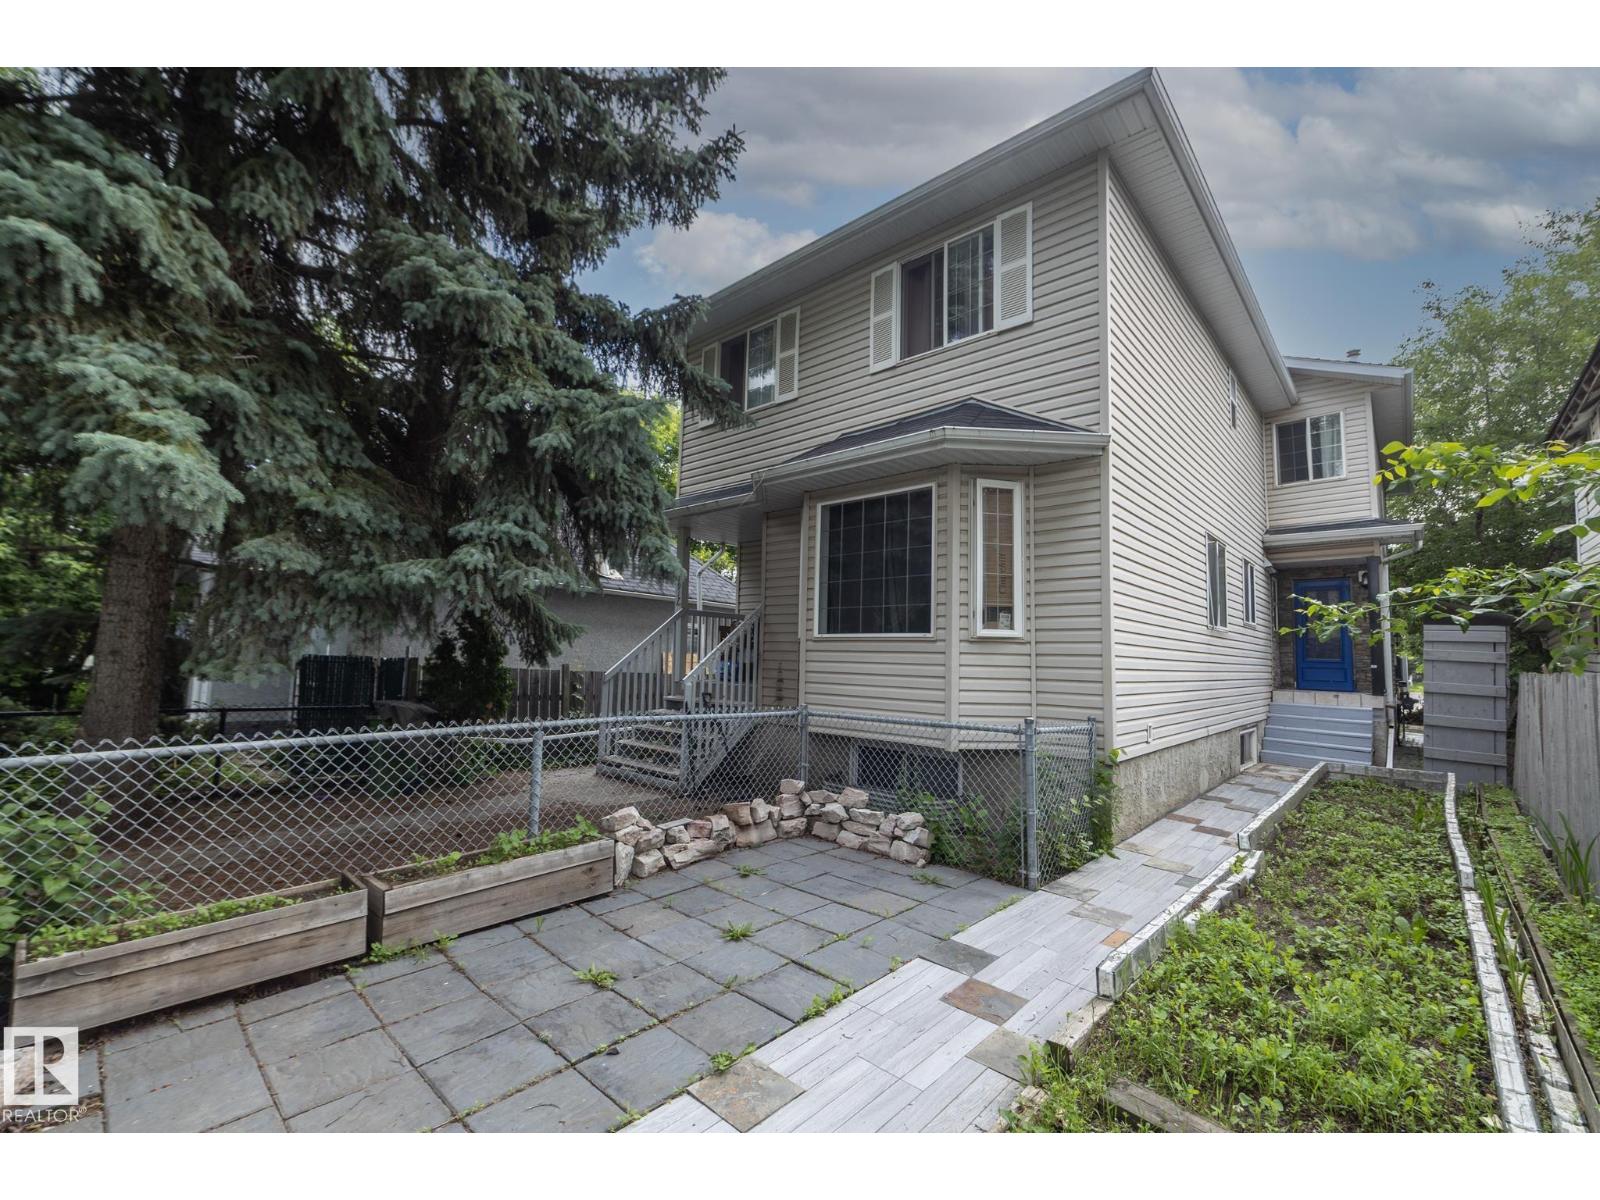 New
New4 bd2+1 ba1,108 ft²$271/ft²
E4499551 · Courtesy of RE/MAX Real Estate
REALTOR.ca New
New4 bd2+1 ba1,511 ft²$827/ft²
E4499550 · Courtesy of RE/MAX Elite
REALTOR.ca New
New6 bd3+1 ba2,236 ft²$326/ft²
E4499548 · Courtesy of Royal LePage Prestige Realty
REALTOR.caBrowse homes by neighbourhood
Christopher Peel · REALTOR®
MaxWell® Polaris
This website is operated by Christopher Peel, REALTOR®, of MaxWell Polaris, Edmonton, Alberta — the brokerage responsible for this website.
The listing data above is provided under copyright by the Canadian Real Estate Association (CREA). The listing data is deemed reliable but is not guaranteed accurate by CREA nor BestYEGHomes. The trademarks REALTOR®, REALTORS® and the REALTOR® logo are controlled by CREA and identify real estate professionals who are members of CREA.
Listing information last updated on July 17, 2026 at 3:20 p.m. MT.
Explore
Family-oriented suburban community with lakes, trails, and modern amenities
Established multicultural community with affordable housing, mature trees, and strong local identity
Lakeside family community with strong neighbourhood identity and modern homes
Newer suburban community popular with young families seeking southwest Edmonton living
Established inner-city neighbourhood blending character homes with modern infill near Whyte Ave
Edmonton's premier residential neighbourhood with historic character homes and river valley access
Edmonton's urban core — walkable, condo-dominant, restaurant-rich, and close to everything
Trendy heritage neighbourhood with river valley views, character homes, and a creative community
Interactive map
Every home for sale, on one map.
Browse live MLS® listings by neighbourhood, then switch layers: assessed values across all 407 neighbourhoods, and how tight our home-value ranges run in each one.
Explore the map
Median assessed value · City of Edmonton data
Home value
What’s your Edmonton home worth?
366,000+ Edmonton properties, already valued — see your estimate in seconds, anchored on City of Edmonton assessment data.
Latest
Time for your cheat sheet on this week’s top stories. Canadian Real Estate Canada Taps Leveraged Hedge Funds For Over 40% of New Debt, Warns BoC Canada’s central bank has growing concerns about how the country is financing its debt. In its annual risk report, the Bank of Canada warns that hedge fund
Strong hiring in leisure and hospitality helped fuel a surge in hiring in the U.S. and Canada last month as the two nations geared up to host the FIFA World Cup starting next week.
Concert Properties Ltd. has announced the formation of a joint venture with a Brookfield affiliate for a Canadian industrial portfolio valued at approximately C$1 billion.The deal brings together eight properties totalling roughly 5.3 million sq. ft across Vancouver, Toronto, Calgary, and Ottawa. Th
June 2026
Prices by property type and area, months of supply, and the monthly report archive — free with an account.
Learn
Calculate your Edmonton property tax, understand mill rates, see how tax varies by neighbourhood, and learn how to appeal your assessment.
Read guide →Everything you need to know about buying your first home in Edmonton — budget, mortgage pre-approval, choosing a neighbourhood, and making an offer.
Read guide →Northwest vs Southeast, Central vs Anthony Henday — a data-driven look at how Edmonton's districts compare on price, property types, and market activity.
Read guide →Entry price points, property type analysis, and area-by-area data for real estate investors considering Edmonton.
Read guide →From the Blog
selling · 7 min
June loosened the sellers' grip without ending the seller's market. What that means for selling a house in Edmonton this July: price, timing, expectations.
Read analysis →buying · 8 min
Edmonton is still a seller's market, but June loosened the sellers' grip. What that means for buying a house in Edmonton this summer, segment by segment.
Read analysis →buying · 9 min
RPR vs title insurance is the classic Alberta closing question. What each one actually covers, what they cost, and when title insurance in lieu makes sense.
Read analysis →Search Edmonton Listings
Browse active MLS® listings across the Greater Edmonton Area
Powered by real data
Updated monthly · Curated by a licensed REALTOR® in Edmonton, Alberta
n/a = fewer than 5 sales; CREA suppresses price data to protect privacy. 0 sales = no transactions recorded for that property type/area this period. Low-volume months (especially January) will show more gaps.